Profitable Trading: Reverse Engineered
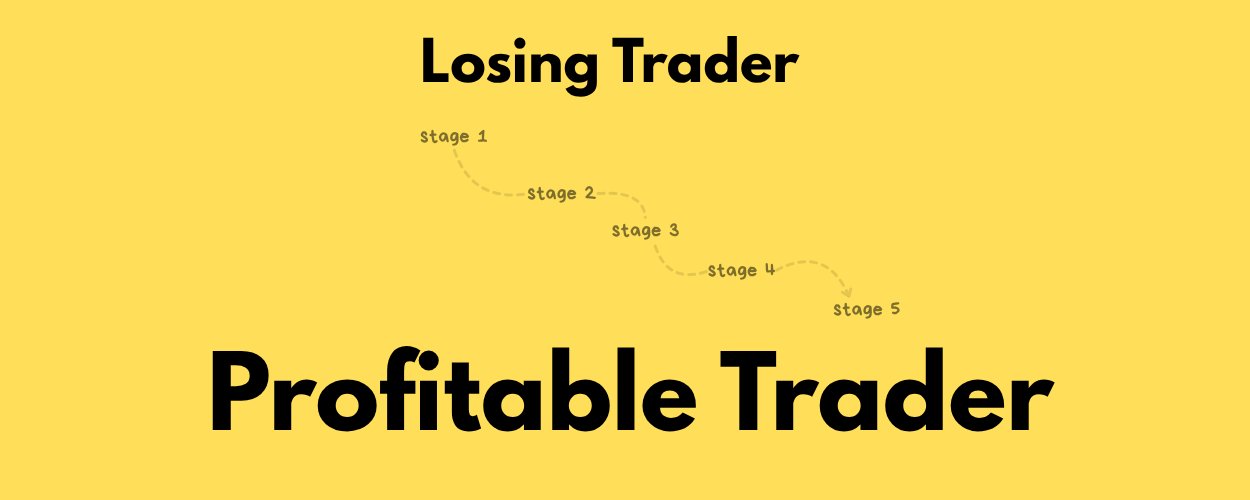
There are 5 Stages I went through from Unprofitable → Profitable.
I’m going to explain each of them below but in reverse.
I believe it will be easier to retain the information this way.
In this article I’m going to explain:
- Help you understand what a “constraint” is
- Explain each of the 5 stages starting from top to bottom.
- I will also explain what was the constraint that had to be solved in order to ascend to next stage
- Present my solution to each constraint at every single stage
I’m going to go pretty in-depth with everything here.
Let’s get started ↓
The 5 Stages and the Theory of Constraints
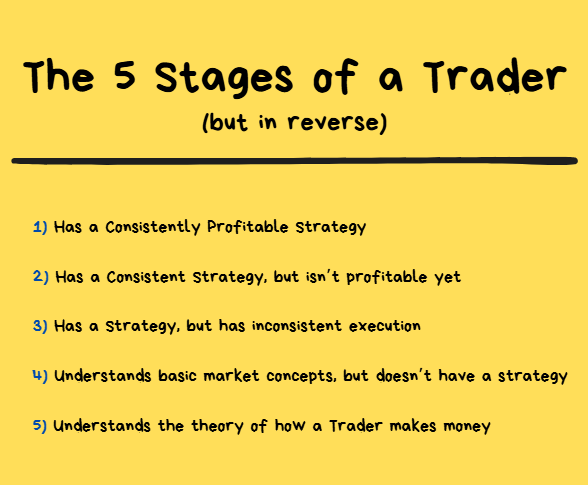
Remember we’re going to go in reverse with this article.
Defining “Constraint”:
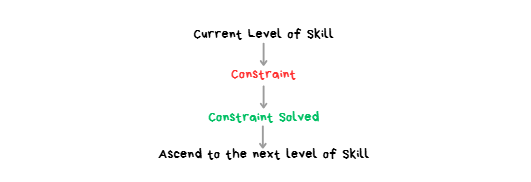
CONSTRAINT: The single biggest bottleneck holding a trader back from advancing to the next level of skill.
- It’s the one biggest problem that, if solved, makes everything else easier or unnecessary.
- An effective approach for improving at anything is identifying the biggest constraint and then pouring all focus, attention and resources into solving that specific constraint.
- This means tunnel vision focusing on solving 1 problem while ignoring all other problems.
In summary, at every stage a trader will need to identify their biggest constraint and continue to chip away at it until it is solved before they can ascend to the next stage.
Below I will get into each of the 5 Stages, their Constraints and how to Solve them. ↓
Stage 1 — Profitable Strategy
gentle reminder that we are reverse engineering this process and going backwards ;)
How to know you are at Stage 1:
• You have a strategy which can generate profits over a large # of trades.
• You have data to show that your strategy has a positive expectancy.
• You have some kind of process for improving your strategy and you have used this process many times already.
Stage 2 — Consistent but Not Yet Profitable
Let’s talk about the Stage that comes right before crossing over to becoming Profitable.
Every trade is being executed in the same way. The only issue is that the strategy isn’t actually making any money.
The point right before having a Consistently Profitable Strategy is having a Consistent Strategy but not necessarily Profitable.
How to know you are at Stage 2:
- You have a “consistent” trading strategy
- entry is the same on every trade
- exit is the same on every trade
- If you were to review 100~ trade screenshots they would all look pretty much the same.
This is the point where you have the skills to do market analysis + you have a strategy but money just isn’t coming in.
It can feel frustrating because it feels like “something is missing”.
That “something” is an “Improvement Process”
Explained below ↓
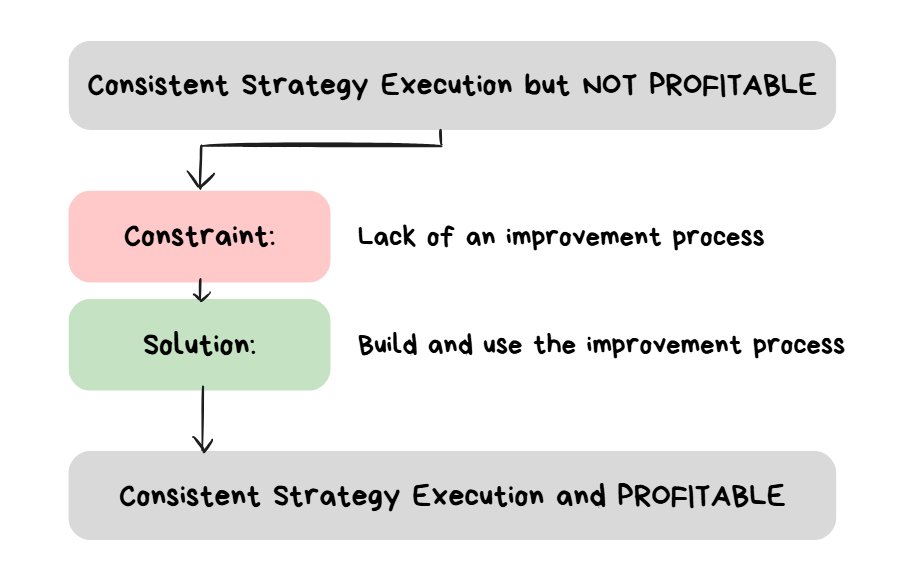
identifying the constraint and solution for Stage 2
QUESTION: What is the thing that MUST OCCUR in order to go from “a consistent strategy but it loses money” to “a consistent strategy but it makes money”?
ANSWER: An improvement process being used multiple times
Explanation
- Imagine a car is at Town A and needs to get to Town B which is 100km away.
- The car MUST BE MOVING in order to get to Town B. If it is standing still then it will not get to Town B.
- If the car is moving, regardless of how slow it is, it will eventually get to Town B.
The Point
- The ONE THING that matters the most at this stage is building an improvement process for your strategy and then using it as much as possible until eventually reaching profitability.
- It’s like having software which has 100 bugs in it. Build a process to identify each bug and fix each bug 1 at a time and eventually your software will work.
- This is a volume game. It’s unlikely that you are going to fix 1 issue with your strategy and magically become profitable.
- It’s more likely that you may need to fix 100+ things
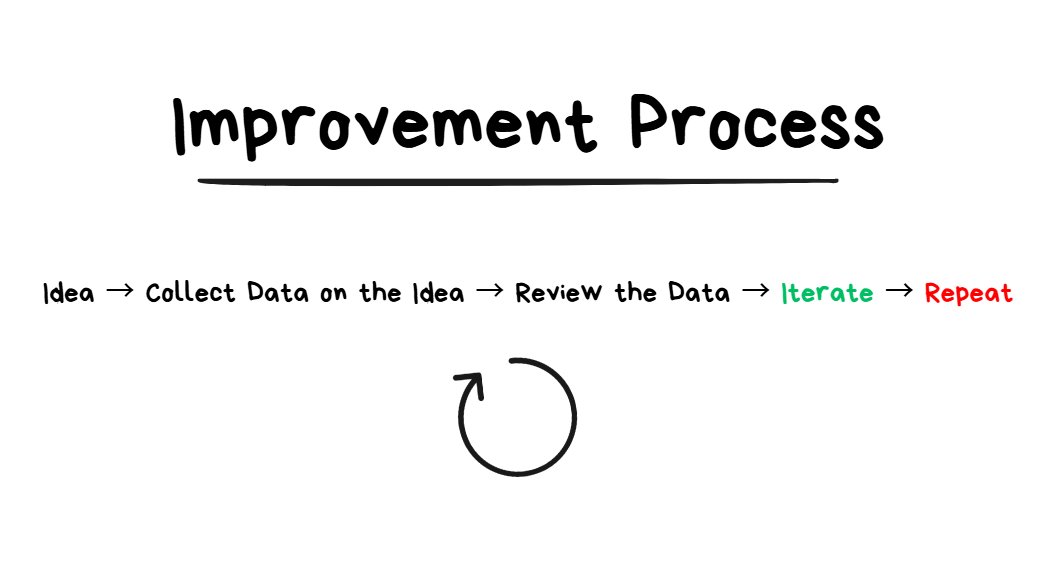
The Solution: Building the Improvement Process
more repetitions with this loop = better ideas
better ideas = better iterations
There are 4 components to the improvement process:
- Idea (“I wonder if X will improve my winrate?”)
- Data Collection (see how many times X appeared in your trades)
- Review Data (see how much impact X had on the winrate)
- Iterate (based on the review, make a change to the trade execution next time X appears for a trade)
If you go through this feedback loop enough times then it is inevitable that you will perform better.
NON-TRADING EXAMPLE:
- Pretend I want to make a “cookie shop” which sells tasty cookies
- I bake 1 batch of cookies.
- I taste them, but feel like they’re not salty enough.
IDEA: I think they’re not salty enough. If I made them more salty then more people would like them.
DATA: I’m going to give my normal cookies and “slightly saltier” cookies to 100 different people and see which one they prefer.
REVIEW DATA: 73% of people prefer the salty cookies.
ITERATE: I will make a small adjustment to the recipe so that the cookies have a bit more salt in them based on the review of my data.
THE POINT: if I was to go through this same process and make 1,000,000 iterations I would have incredibly good tasting cookies by the end of it.
Important Reminder: Not All Reviews Will Find Alpha
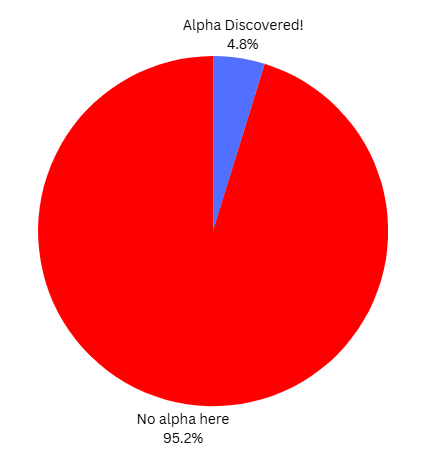
Only X% of your reviews will lead to finding “alpha” (a potential improvement in your strategy).
X is going to be a low number.
When you go through this “improvement process” multiple times you may find that a lot of the time you find yourself empty handed.
You had an idea, collected data on the idea, reviewed the data and it turns out there’s nothing special about the idea.
This doesn’t mean that “you suck” or that “your process is broken”.
This is just how things are. Edge is like a needle in a haystack. The sooner you accept this, the easier everything else will be.
When the above is understood, it then becomes clear that there are 4 things to be optimizing for:
- QUANTITY of data (how much data do you have)
- QUALITY of data (how statistically significant is the data)
- QUANTITY of reviews (how many reviews are you performing each month)
- QUALITY of reviews (increasing the likelihood of finding alpha within a review)
If you make ANY of these 4 go up, you will find MORE alpha.
This is a game of brute force.
Let’s use an extreme example:🤓
- You have 1,000,000,000 ideas about the market.
- You collect 1,000,000,000 data points on EACH idea.
- You review all 1,000,000,000 data sets
- 999,999,000 reviews end up going nowhere
- 1000 reviews end up finding real alpha
- If you have 1000 pieces of real alpha, you will become very profitable.
This should make it crystal clear that this is a game of brute force.
Get MORE ideas, TEST more ideas, REVIEW more ideas and you WILL FIND MORE ALPHA.
It sounds simple but it is hard and time consuming.
A Practical Improvement Process
So there’s really only 2 things that we can do to make more money:
- Option 1: Make MORE profitable decisions
- Option 2: Make LESS unprofitable decisions
The 2nd one is generally a lot easier to start with.
You can do literally EVERYTHING the same in your process but if you just make LESS MISTAKES then you will make MORE MONEY as a result of it.
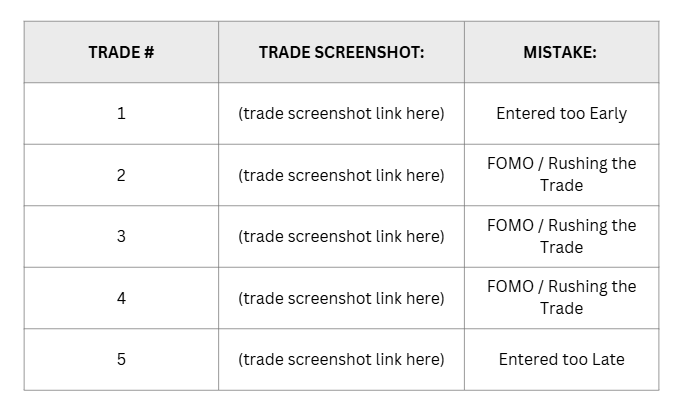
the easiest trade screenshot review you start with:
- finding trade execution mistakes
Before you start looking for super duper new Alpha, start with the raw basics.
- Identify every trade where you broke the rules of your trading strategy. Put all of those screenshots in a column of a spreadsheet. (it doesn’t even matter if the strategy is profitable or not. The point is you need to stick to the rules)
- Find the most common mistake
- Introduce an input which decreases the chance of the same mistake happening again.
Two Examples:
Entering too early? - use a checklist for all criteria that needs to be met
Entering too late? - use more alerts to give you more of a heads up that a potential trade is coming
Taking This Even Further
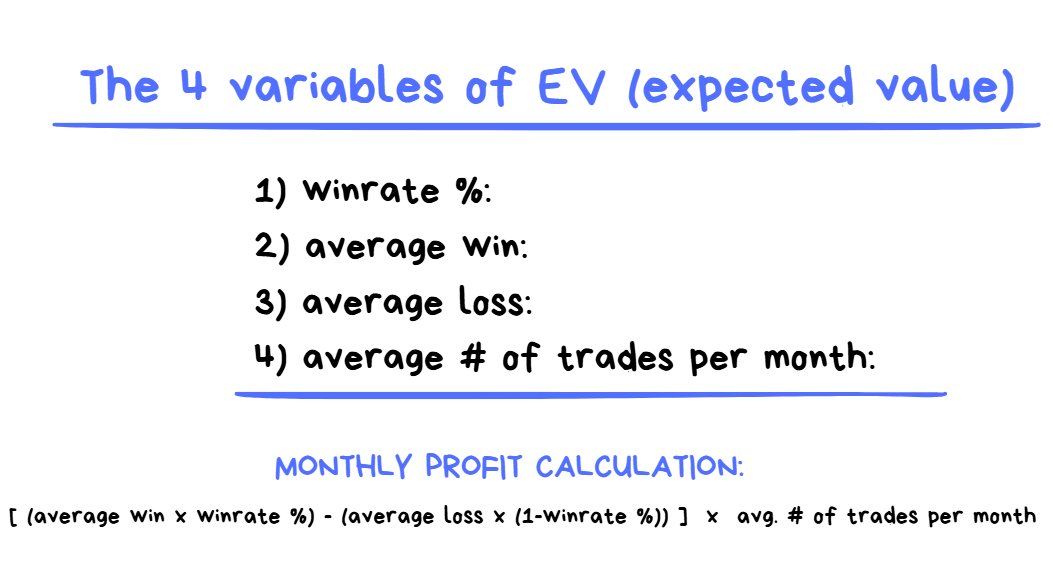
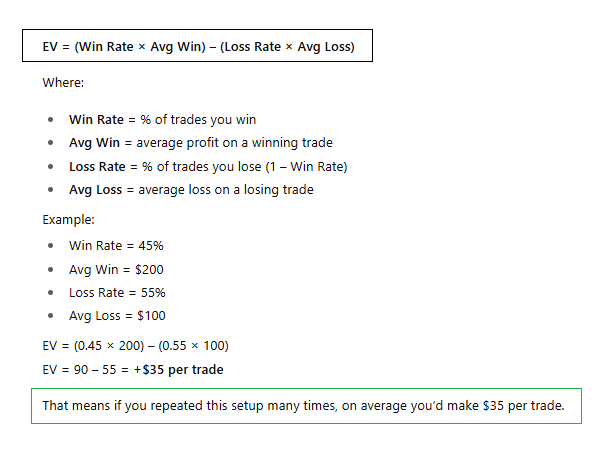
“the 4 variables of EV” and “the monthly profit equation”
After you have eliminated all mistakes from your execution the next step is to get creative.
You’re going to have to come up with ideas which impact any of these 4 variables in your strategy execution:
- Improve Winrate %:
This can be done by taking MORE GOOD TRADES or LESS BAD TRADES
2. Increase Average Win
This can be done by RISKING MORE ON GOOD TRADES or INCREASING THE WIDTH OF YOUR TARGETS
3. Decrease Average Loss
This can be done by CUTTING LOSERS EARLIER or REDUCING COSTS (fees/slippage)
4. Increase Trade Frequency
This can be done by INCREASING SCREENTIME , MORE/BETTER ALERTS and/or introducing MORE STRATEGIES into your toolbox.
From personal experience, this is the specific order I have found most effective to take for strategy improvement (based on amount of effort it takes to collect/review the data relative to the ROI of the insights gained from the dataset) :
- make fewer mistakes (increases winrate)
- take fewer low quality trades (increases winrate)
- cut losers faster on A+ setups (decreases avg. loss)
- risk more on A+ setups (increases avg. win)
- wider TP on A+ setups (increases avg. win)
- more/better alerts (increases frequency)
- introduce more strategies into toolbox (increases frequency)
If you use the Improvement Process Loop for 100 ideas on each of these 7 things it would be unreasonable to not find improvements within your execution.
Yes, this means coming up with 700 ideas, collecting 700 data sets, performing 700 reviews and iterating accordingly.
It’s simple but it takes effort and time.
Summary of Stage 2
If you have a strategy and you’re consistent with executing it but you’re NOT profitable yet, the thing that you’re missing is an improvement process. Use the “idea , collect data , review , iterate” loop to eliminate mistakes. Once all mistakes are eliminated, use the loop over and over again to make improvements to any of the big 4 variables in the EV equation which make up your monthly profit.
If you keep going through the loop you WILL find improvements and you WILL make more money.
Stage 3 — Inconsistent Strategy
Before having a consistent strategy, you must have an inconsistent strategy.

How to know you are at Stage 3:
You have a strategy but none of the trades look the same.
This is a problem because it makes Stage 2 harder to pass.
If every trade has different rules for entry, stoploss, target and management then it’s going to be really hard to find improvements.
Let’s use the Cookie Shop analogy again to explain how this is a problem:
- Imagine you bake 20 cookies.
- Each cookie has a different shape, size, color and flavor.
- If you try to put your cookies through the Improvement Process it will be too challenging to know what variable needs to be improved.
- 5 people might say too salty, 8 people might say too sweet, 3 people might say not sweet enough … the feedback from the data you collect will be all over the place and cannot be reliable because none of the cookies are the same.
- But if you bake the IDENTICAL cookie with ALL variables kept equal, you will be able to trust the data if 80% of people say “not salty enough”.
The Solution: Consistent Trade Execution
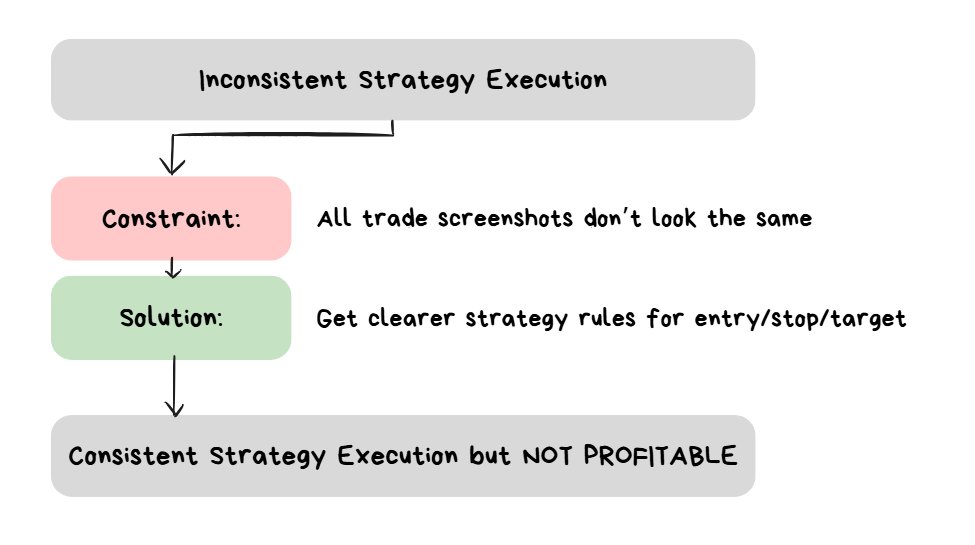
When all trade screenshots look pretty much the same, then the constraint has been solved.
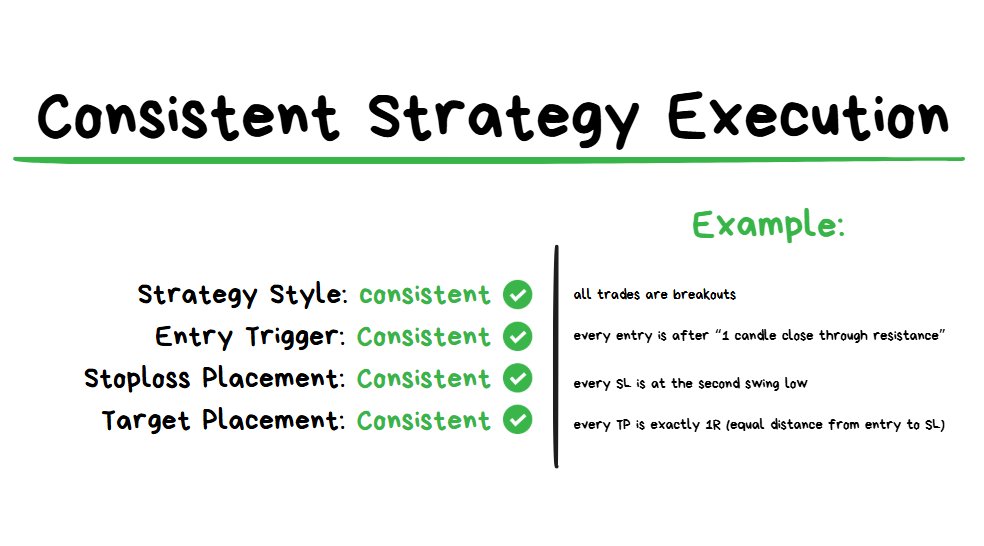
Consistency > Quality
FIRST make everything the same. You can optimize each of these LATER.
These problems I was facing while I was in this stage:
- I was trading BOTH breakouts and reversals, instead of just 1 style.
- I would be entering trades based on gut feel, instead of a clear entry trigger
- My stoploss would be placed at a place which “felt right” , instead of using a specific location every time.
- My target would also be based on gut feel, instead of using a specific target every time
The issue was that I was too short-sighted. I wanted to make money immediately and wanted to just skip over this step. If I thought it was good to trade reversals I would just trade reversals, if I thought it was good to trade breakouts I would trade breakouts… but from doing so many different things at the same time I was average at everything.
Mediocrity in Trading = NOT PROFITABLE.
🧠 SOLUTION = consistency. MAKE EVERYTHING THE SAME, DON’T WORRY ABOUT SHORT TERM RESULTS.
Eventually I realized that the only way that I could improve was to keep literally every single variable THE SAME and as SIMPLE AS POSSIBLE.
This means optimizing for CONSISTENCY rather than optimizing for RESULTS.
If execution IS NOT CONSISTENT but getting good results: then improving this strategy is going to be a really hard and slow process. I don’t want this. ❌
If execution IS CONSISTENT but not getting good results: then improving this strategy is going to be a fairly straightforward process. Even though short term results might suck, there’s a clear path forward for continuous iterations and fast learning/improvement. I want this. ✅
CONSISTENCY > SHORT TERM RESULTS
Summary of Stage 3
At this stage you have a strategy but the execution of the strategy is inconsistent and all over the place. In order to get over this stage you’re going to need consistent execution. This means same strategy style, same entries, same stoploss placement and same targets. If you want to get over this stage you’re going to have to let go of “perfection”. Accept that the short term results will suck, this is fine. The point is to make the strategy as EASY AS POSSIBLE to improve (by collecting lots of consistent data). The more identical your trade screenshots look, the easier the strategy will be to improve.
Stage 4 — No Strategy
Before having an inconsistent strategy, this is the stage of “having no strategy”.
at this stage understands basic technical analysis + risk management. The issue is just doesn’t know “what to actually do” in order to execute.
There are a lot of traders at this stage.
How to know you are at stage 4:
- You know some basic price action principles (e.g. bullish/bearish market structure)
- You know how to use an exchange and execute trades
- You know risk management basics
- But you DO NOT have any strategy with clearly defined rules for entry/stop/target/management.
The Solution: Having Some Strategy Rather Than None
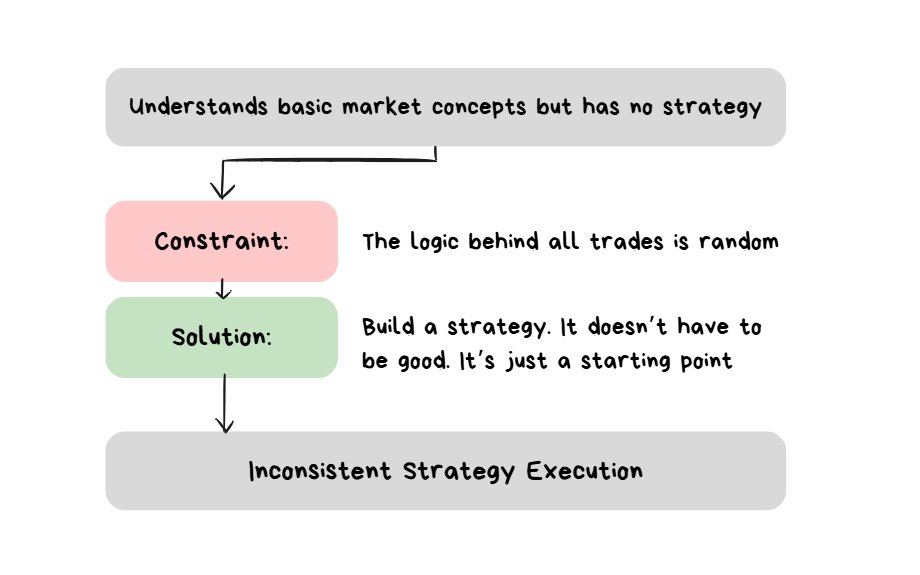
something is better than nothing. This is not the time to worry about “quality” … (yet).
Without a strategy, throwing on longs/shorts blindly is really no different to going to a casino to gamble.
“Red or Black” v.s. “Up or Down” - same game, different name.
To overcome this stage a strategy needs to be built. Just SOMETHING. It doesn’t even have to be good. You can always “make it good” later.
Trying to immediately “make something good” with absolutely no reference points is foolish.
The Clay Pottery Class Analogy:
- A pottery teacher splits his class into 2 groups. Group A and Group B.
- Group A: their goal was to make the best looking clay pot in 30 days.
- Group B: their goal was to make as many clay pots as possible in 30 days.
- Result: Group B inevitably ended up making better looking clay pots (without even trying to) just because they had more repetitions and iterations.
- The point: get a high volume of reps FIRST. Do optimization SECOND.
The Four Components of a Trading Strategy
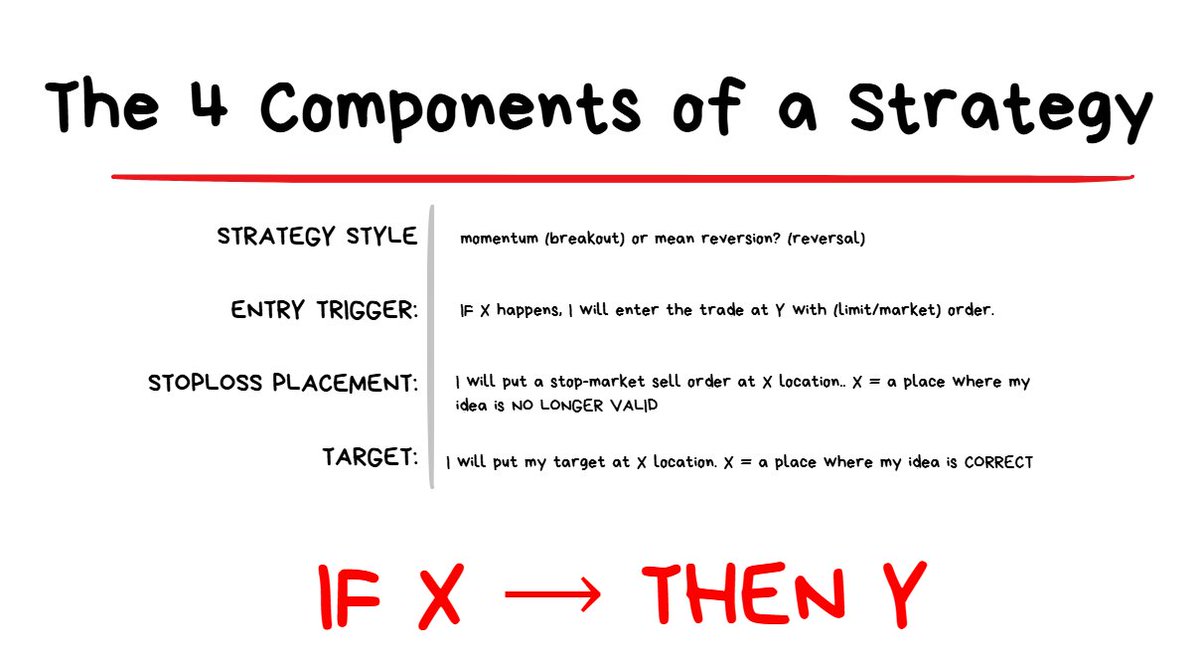
each component of a strategy follows a “IF X –> THEN Y” framework.
If X happens –> then I will do Y action.
If X does not happen –> then I will not do Y action.
STRATEGY STYLE: Momentum or Mean Reversion
- Momentum = betting that price will “break” a level
- Mean Reversion = betting that price will “reverse” from a level
- You’re going to have to pick if you want to trade Momentum or Mean Reversion to start off with.
- It doesn’t matter which one you pick because in the long term you will inevitably learn how to trade both.
- I recommend starting with Momentum because it’s easier and there are less variables you have to consider.
ENTRY TRIGGER: if X happens, I will place my entry at Y using (limit/market) order.
- The more simplistic the approach you have for defining X and Y, the easier everything else will be.
- Remember, simple is best at this stage. It’s not about finding the winning combination yet. It’s about having something that will be EASY to collect data on and EASY to iterate/improve.
- I suggest starting with limit order entries.
- Accept that you will miss some winning trades when using limit orders for entry. This is a feature, not a bug.
- As long as missed trades are journaled it will be easy to review them and easy to introduce market orders to start catching some of those missed trades.
STOPLOSS PLACEMENT: If X happens, I will put my stop-market sell order at Y location.
If going LONG = place stoploss at a swing low.
If going SHORT = place stoploss at a swing high.
❗️NOTE TO READER: will discuss market structure + price action concepts a bit further down below.
TARGET PLACEMENT: If price reaches X = my idea is correct.
- Assume that the first attempt of creating this rule for your target placement is NOT GOING TO BE OPTIMAL.
- It’s either going to be TOO WIDE or TOO TIGHT.
- Question: If I had to pick, would I rather have a TP that is too wide or too tight?
- Answer: Too tight.
- Reasoning: to improve a tp that is too tight you just have to look at winning trade screenshots where price extended beyond the TP by “N units of R” and then optimise from there. It’s straightforward. However to improve a tp that is too wide you have to look at losing trade screenshots where price went N units of R onside and then turned around and turned into a losing trade. It’s a tougher process.
Further Reading: Momentum Trading Strategy
Jul 31, 2025
Summary of Stage 4
If you have no strategy, the only way to move forward is to build a strategy. Something is better than nothing. Get some rules in place for the Strategy Style, Entry Trigger, Stoploss Placement and Target Placement. Don’t waste time trying to optimize it or make it perfect. Just build SOMETHING. After you have SOMETHING, you can go and optimize it AFTER you collect some data with using it.
The constraint is solved as soon as you can clearly state the rules of your strategy.
Stage 5 — Learning the Basics
The trader knows what “expected value” is and understands that the goal of a trader is to capture as much of it as possible.
The trader just has no idea where to start with the basics of the technicals.
It’s not about winning the next trade. It’s about having a profit over the next N number of trades, where N is a large value.
How to know you are at Stage 5:
- You understand the importance of having an Edge
- You understand what Expected Value (EV) is
- You know basic Risk Management concepts
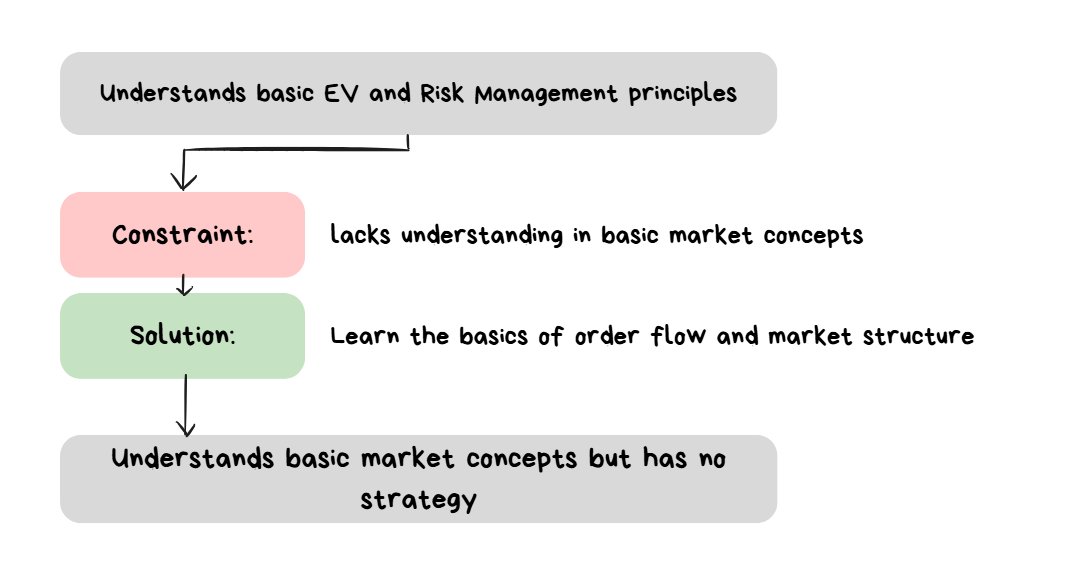
Before building a strategy, a Trader has to at least understand the basics of how markets move and some basic price action concepts.
The Solution: Learning Market Structure + Price Action Basics
Before getting into the practical (actually doing stuff), one has to learn at least some basic theory (how stuff works).
These are the 2 Topics I will cover below:
-
- How do markets move (market/limit orders basics)
-
- market structure + regimes basics
You don’t have to remember each and every single detail. It is more important to just understand the basic concepts.
After a basic understanding of the concepts is achieved does it make sense to start looking into building a strategy.
1) How Do Markets Move?
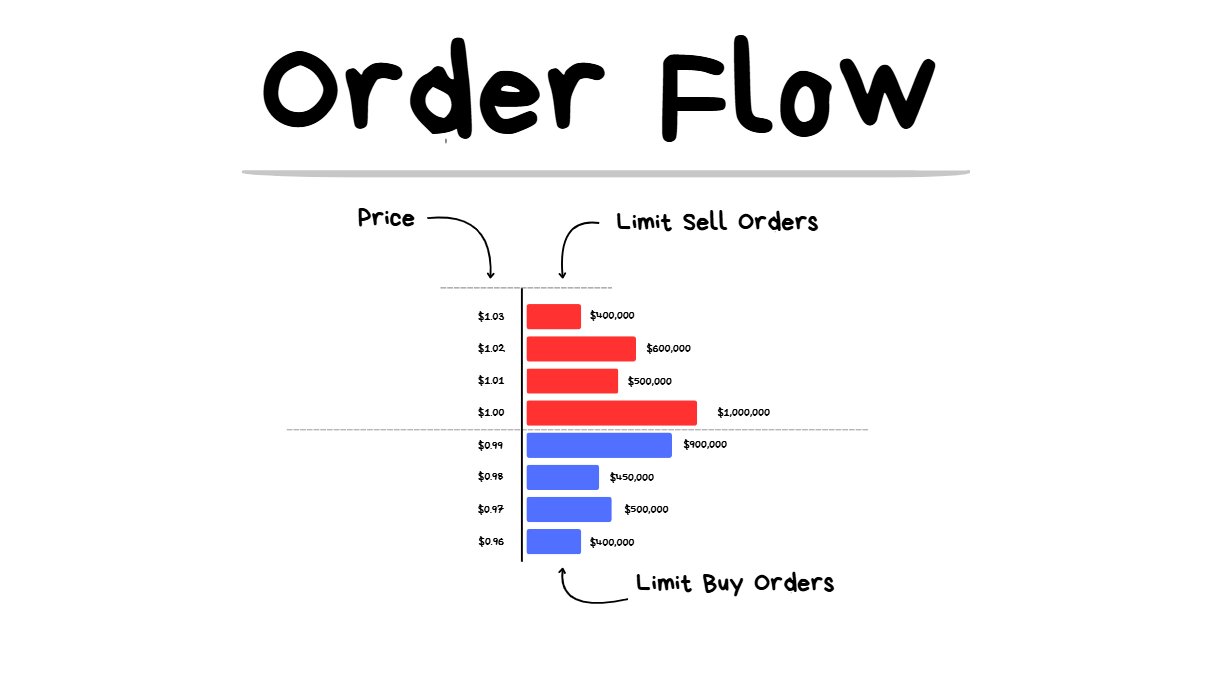
order book
The two order types:
- Limit Orders (I am advertising to execute a trade at X price. My trade will only execute if another participant wants to execute at my price.)
- Market Orders (I want to execute a trade NOW. I will pay an extra fee to get my trade executed immediately at whatever the best available current price is.)
Example using Apples: 🍎🍎🍎🍎🍎
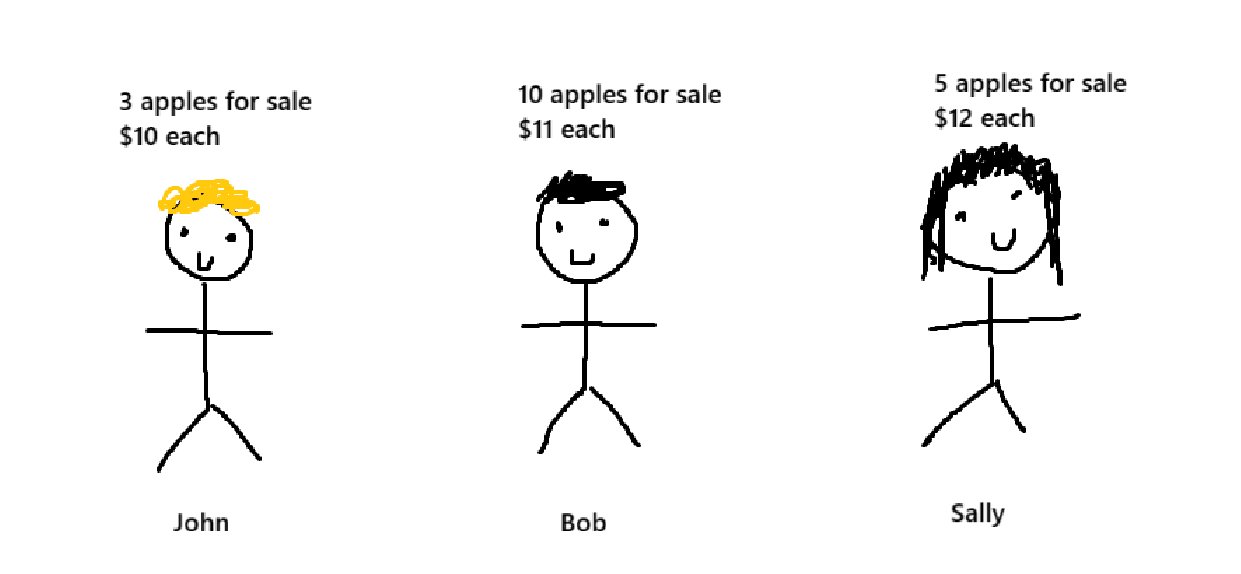
admire my beautiful creation on MS paint while you learning about order flow basics
If you want to buy 1 apple NOW (market buy) , you will buy 1 apple from John at $10 since $10 is the cheapest “limit sell order) available at the moment.
The last traded price of “apples” will be $10.
Then you realize you actually needed 4 more apples to bake your apple pie, so you go out and “market buy” 4 apples.
You instantly buy the 2 remaining apples from John at $10 each. John has now sold out of apples.
The next best available price for apples is $11 and Bob has 10 apples for sale. So you buy 2 apples from Bob at $11 each. Bob now has 8 apples remaining at $11 each.
So what happened:
- you “market buy” 1 apple, price = $10
- you “market buy” 2 apples, price = $10 (all available supply is gone now)
- you “market buy” 2 apples, price = $11 (you pushed the price up)
A common Question that is often asked by traders is “Why did the Price go from A to B?”
- The only correct fundamental answer to this question is “because a bunch of market orders came through”
- There are an infinite # of possible reasons as to WHY traders were buying/selling. Some Examples: reacting to news, hedging a position, speculating on price action, arbitraging, blatant gambling etc.
- But we can never truly know the “why” because there will always be X% of information that is unaccountable for and impossible to collect/track/review.
- The only thing that we really know is that “market orders executed against resting limit orders, pushing the price from A to B”
Behind all the fancy indicators and lines on a chart is just an order book filled with makers (people who are advertising to buy/sell with limit orders) and takers (people who bite on the advertisement and execute a market order).
Ultimately, everything comes down to these 2 things:
- How much $ is there in limit orders? (supply)
- How much $ is coming through in market orders? (demand)
2) Market Structure + Regime Basics
Below I’m going to cover the following:
- Swing Highs and Swing Lows
- Bullish/Bearish Market Structure
- Breaks of Market Structure
- What is a Regime (market environment)
- Regimes on a “continuum”
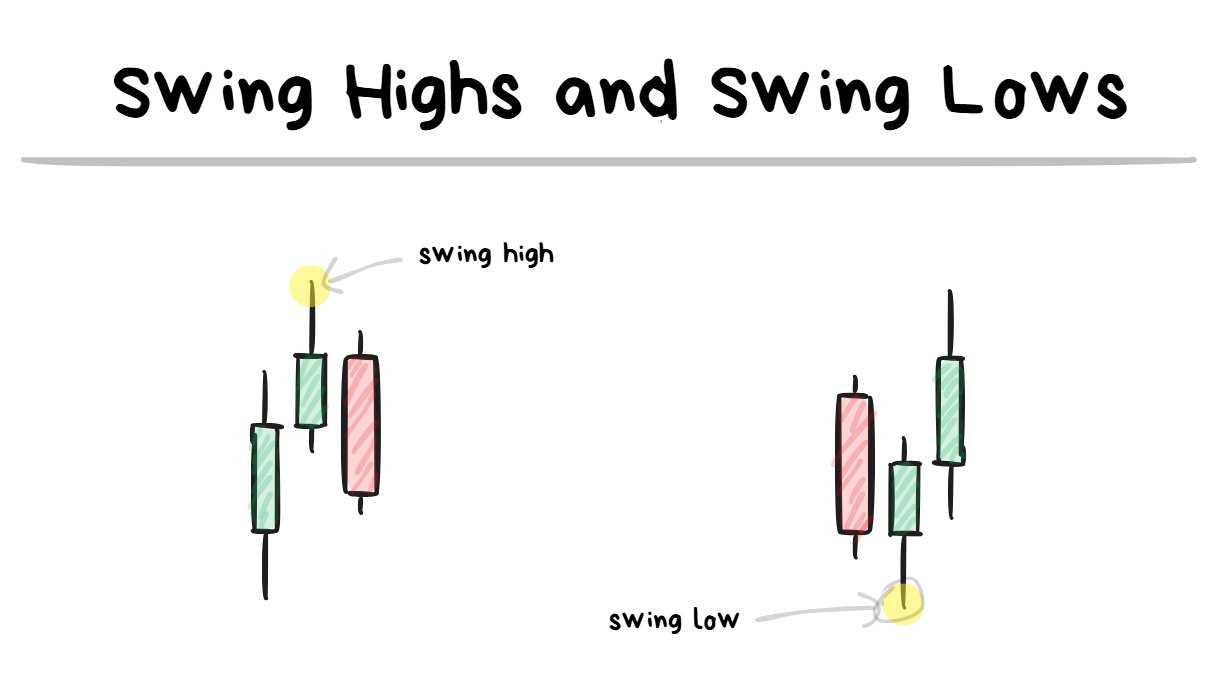
swing high/lows are turning points on the chart.
a low will look like a “V” and a high will look like an “upside-down V”
I believe the swing highs/lows are pretty self explanatory.
They are just previous turning points on the chart.
It requires at least 3 candles to form a swing level with the “extreme” being the level I look at.
the highs/lows in the diagram above are referring to “swing highs” and “swing lows”.
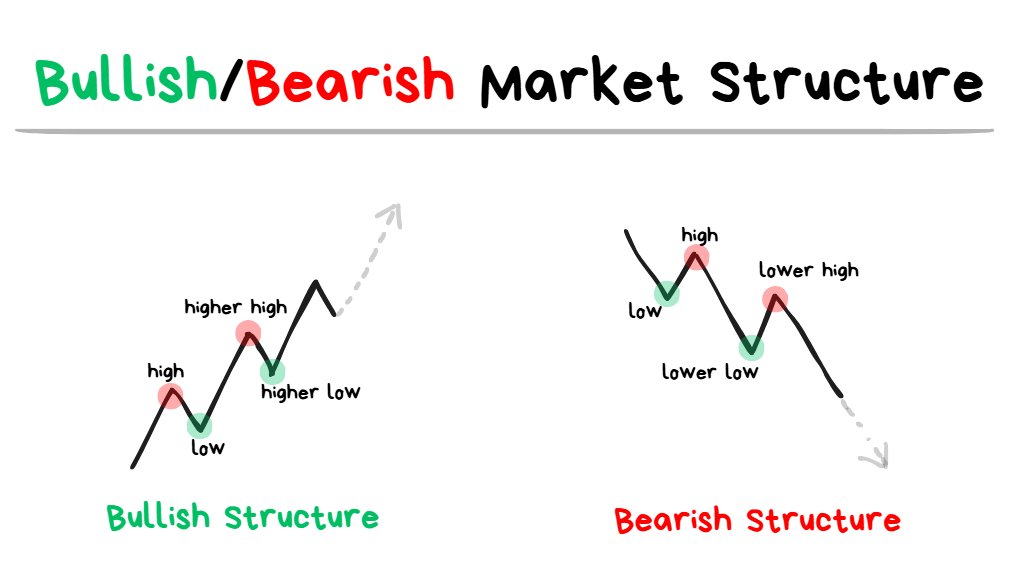
🐂Bullish Market Structure:
- Has higher highs and higher lows
- Expecting higher prices as long as structure remains in tact.
🐻Bearish Market Structure:
- Has lower highs and lower lows
- Expecting lower prices as long as structure remains in tact.
Break of Bullish Structure:
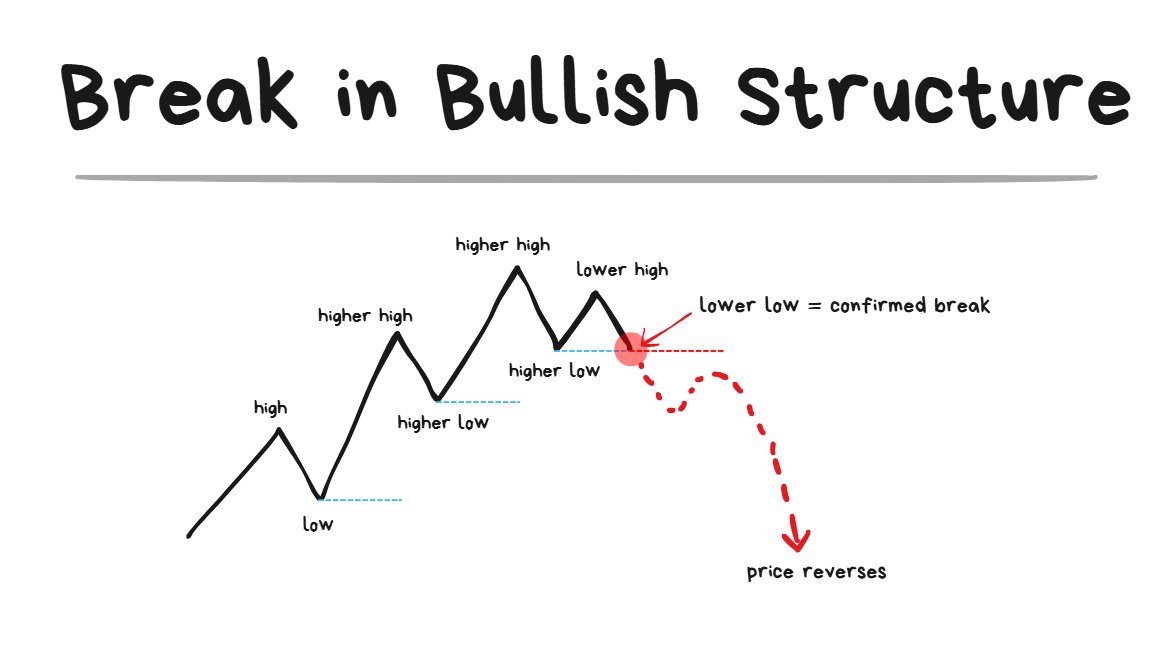
once the Lower Low comes in = the structure has broken.
- Just because a Lower High comes in does NOT mean the structure has broken yet
- The structure is only broken when the Lower Low comes in.
- A Lower Low = the breach of the most recent swing low that was formed.
Break of Bearish Structure:
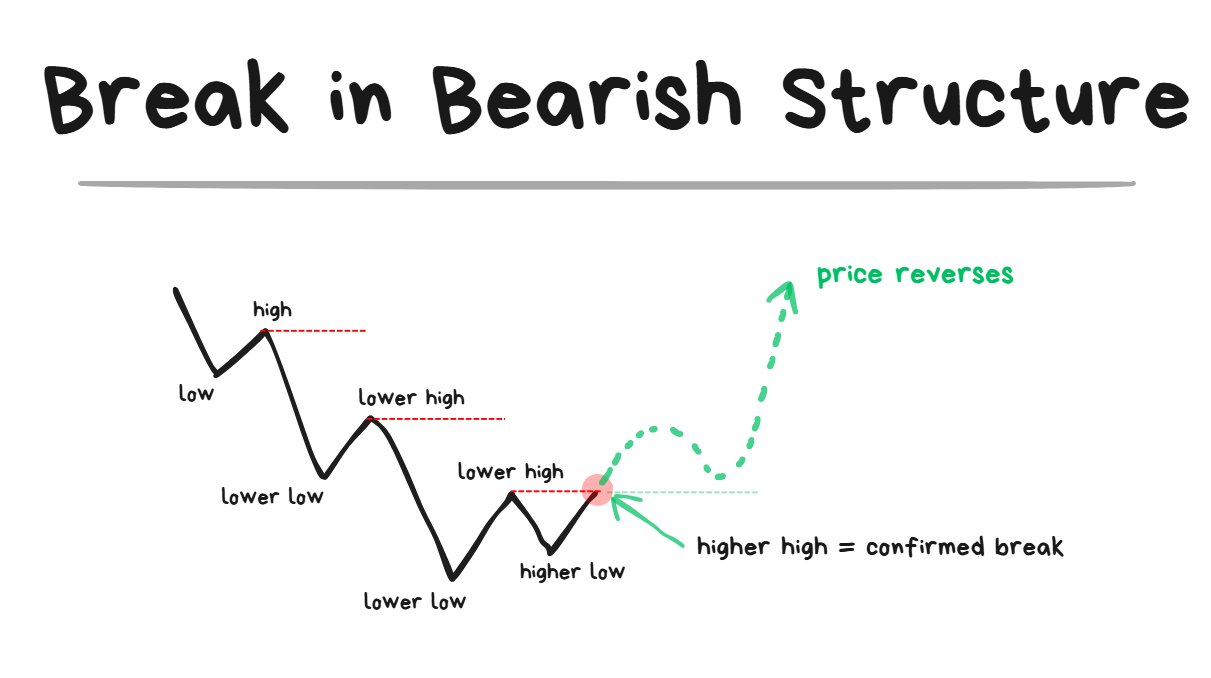
Once the Higher High comes in = the structure has broken
- Just because a Higher Low comes in does NOT mean the structure has broken yet.
- The structure is only broken when the Higher High comes in.
- A Higher High = the breach of the most recent swing high that was formed.
What Is a Regime?
A “Regime” is just a way to define a specific type of market environment.
Some regimes are more suitable for one style of strategies and other regimes are more favorable for other types of strategies.
Since market conditions change all the time, a big part of being a trader is being able to recognize the changes in regimes and adapt accordingly.
Jul 21, 2025
Creating a Market Bias If in sync: • risk more + trade more If out of sync: • risk less + trade less ↓
I like to have 2 types of biases I like to use:
- Directional (favored for longs or shorts?)
- Structural (favored for breakouts or reversals?)
If you were to look at any price action chart you may notice that a Break of Structure isn’t 100% guaranteed to result in a reversal.
Sep 10, 2025
My 2 favorite Trading setups ↓
In a Strong Bullish Trend: ❌
- as soon as price comes into the swing low, traders will quickly jump in to buy the discounted coin and price will accelerate higher.
- Betting on a reversal on a break of structure will NOT be ideal.
- Same logic applies to strong bearish trends too.
In a Weak, Sideways Choppy Range: ✅
- Price will continuously fail to break out of the major key levels
- As soon as the break of structure comes after the failure, the reversal is a lot more reliable.
The point: don’t obsess and try trade every single structural break. You’ll get burnt doing this in the wrong market environment. These work best in sideways environments.
Regimes on a Continuum
Sep 2, 2025
The 2 main Trading Styles I rely on explained↓
It’s not as simple as labelling a regime in a binary way. I’ve found it more helpful to think in terms of a continuum.
Examples:
- Sure a regime can be good for longs, but HOW GOOD is it?
- Sure a regime can be favorable for momentum trades, but HOW FAVORABLE is it?
- Sure price action can look choppy, but HOW CHOPPY is it?
The more clearly you can define the start/end points of a regime and also the changes in regimes = the easier trading will be.
Most traders obsess about optimizing their trading strategy but optimizing how you read the current market conditions (regime) is going to take you much further.
Summary of Stage 5
Once you understand the basics of Expectancy and Risk Management the next step is to learn the basics of price action.
Understanding how markets move with limit/market orders + market structure + regimes is a solid foundation to have.
Just remember:
- Directional Bias: up/down
- Structural Bias: trendy/choppy
If you can get a basic read on both then you can start developing a trading strategy to specifically take trades in 1 of those regimes.
Conclusion
Before you can have a profitable trading strategy, you will need a consistent trading strategy (which doesn’t need to be profitable yet).
In order to get from consistent strategy (unprofitable) to consistent strategy (profitable) you will need an “improvement process” where you come up with ideas, collect data on those ideas, review the data and make iterations accordingly.
Before you can have a consistent strategy (unprofitable) you will need to have some kind of strategy (but it doesn’t have to be consistent). The way to go from inconsistent to consistent is to get clearer definitions on your entry/exit rules + get a bit more systematic with the trade execution.
Before building a strategy you’re going to need to learn the absolute basics of how markets move (limit/market orders) and some price action basics. Your strategy should be built around performing well in ONE specific regime.
Final Words
Well done for pushing through this article. This was a pretty lengthy one.
Now you should have a bit more clarity on how my own trading journey looked like and maybe you can use parts of it as inspiration to replicate in your own.
If you really did take the time to read through this, then don’t hesitate to comment any questions.
I will take my time to go through ALL questions you guys put into the comments. Don’t be shy.
Good luck trading~ 🤝
Source
Written by @spicyofc · View original post · Published: 2025-07-31 �������������������������������������������������������������������������������������������